> AON-M2 Series > Operation Guide > Graphical User Interface > Graphical User Interface (Marlin) > Temp Page > Graph Tab
Graph Tab
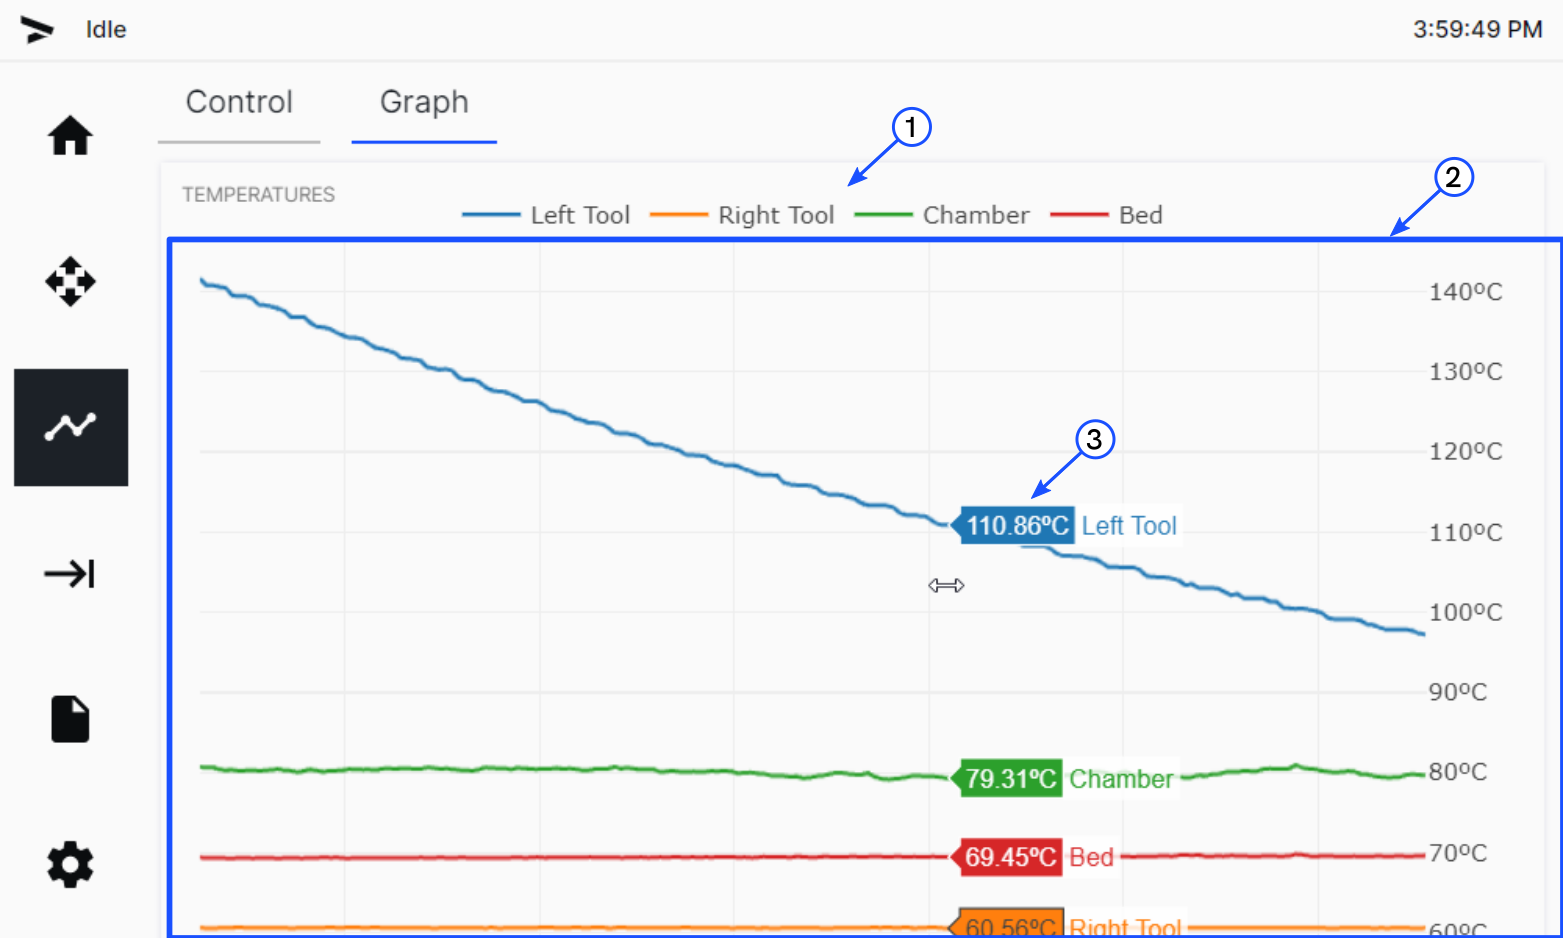
The Graph tab shows the user the last 60 minutes of temperature data of the four heaters in the machine.

Legend
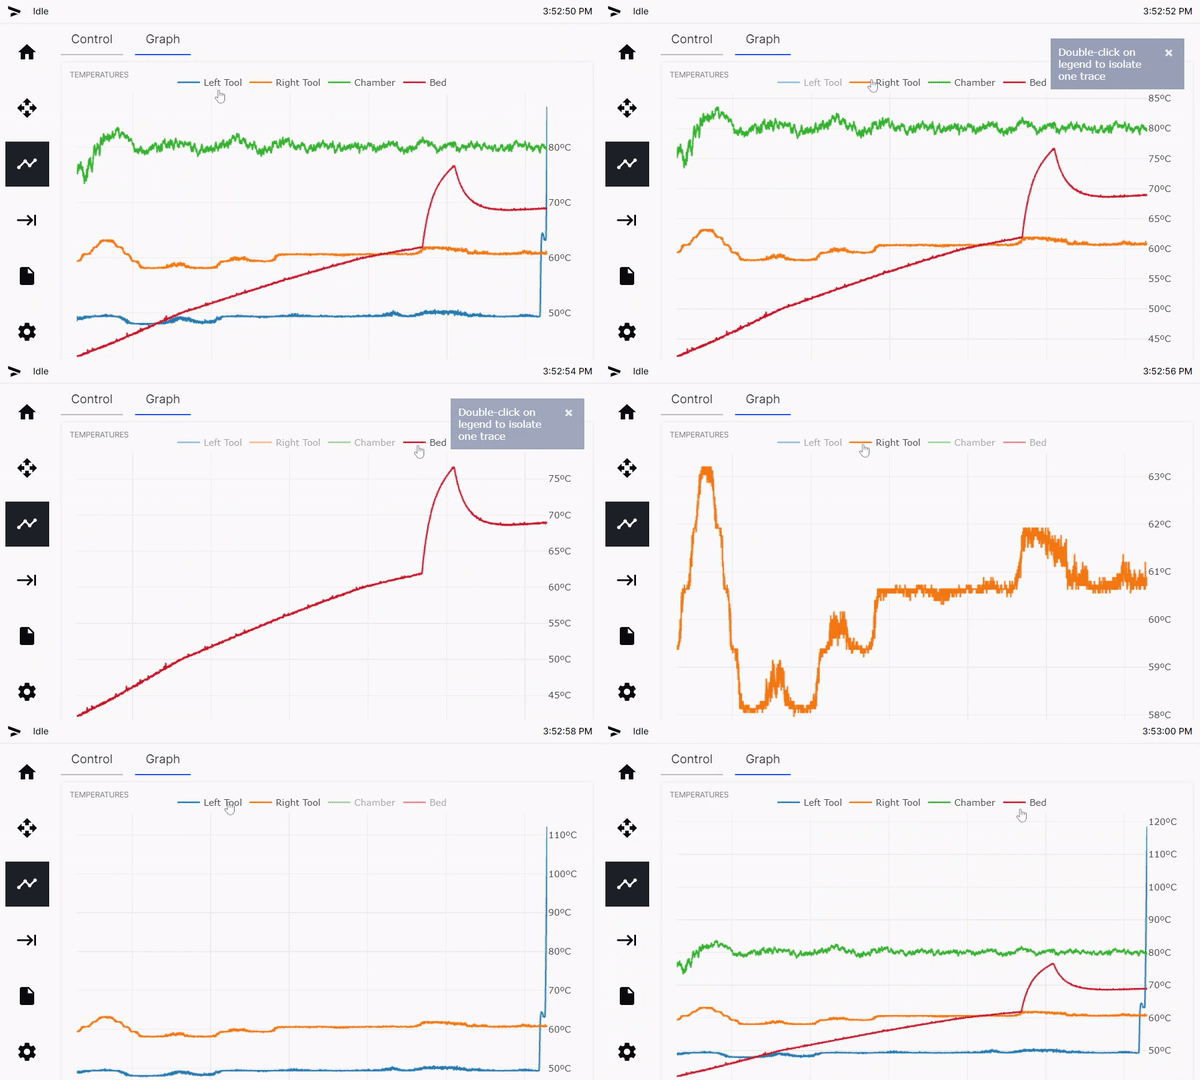
Shows the legend of the graph and allows a user to enable or disable a dataset. Click the legend entry to toggle a dataset ON or OFF.

Graph Area
Shows the last 60 minutes of temperature data for the four heaters in the machine.
Temperature Values
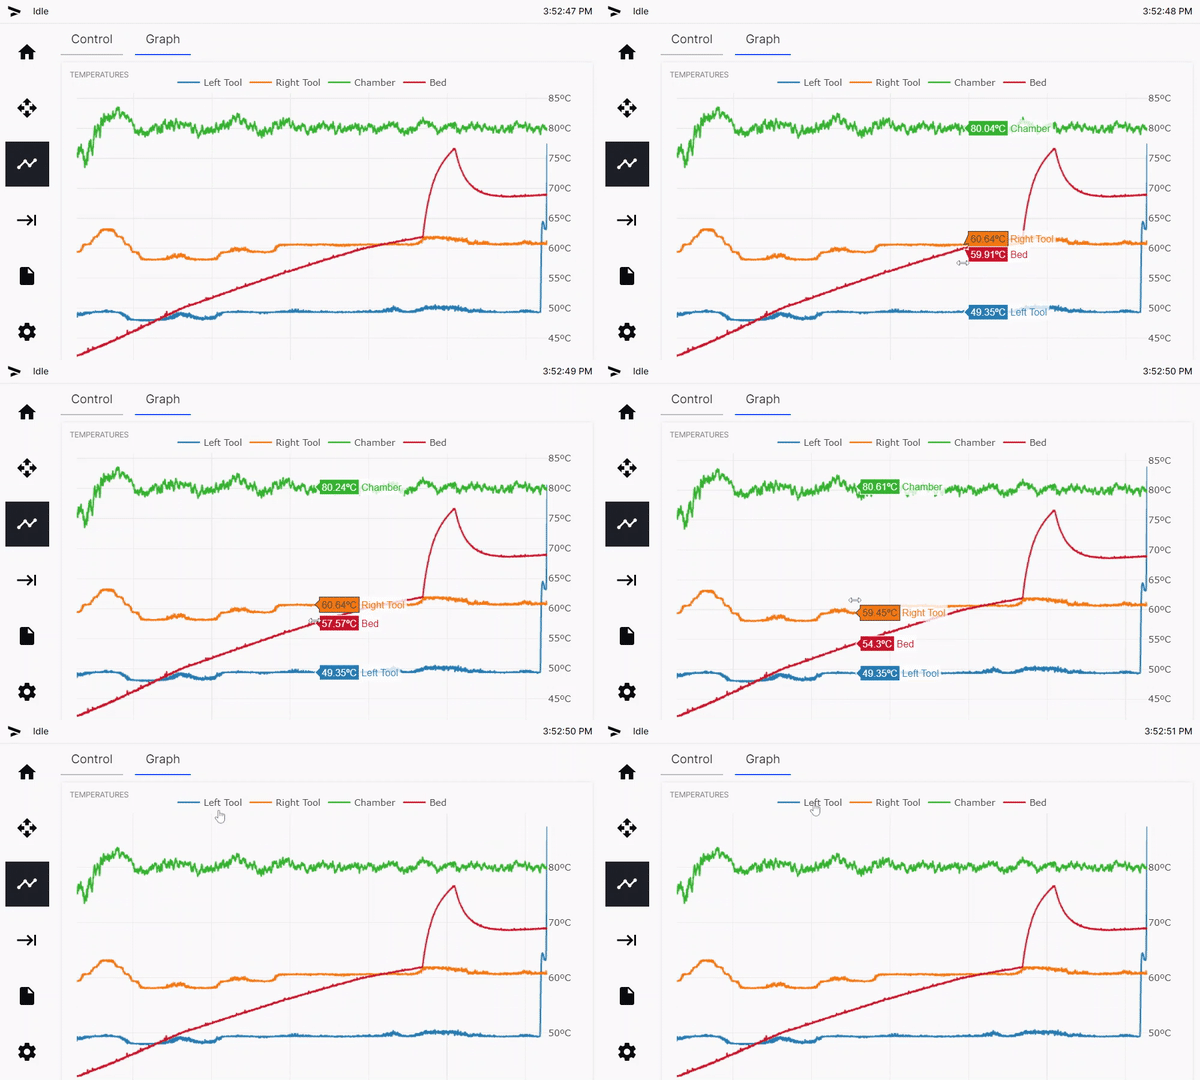
Allows the user to move the cursor in the graph area and show the temperature data at the selected point.
